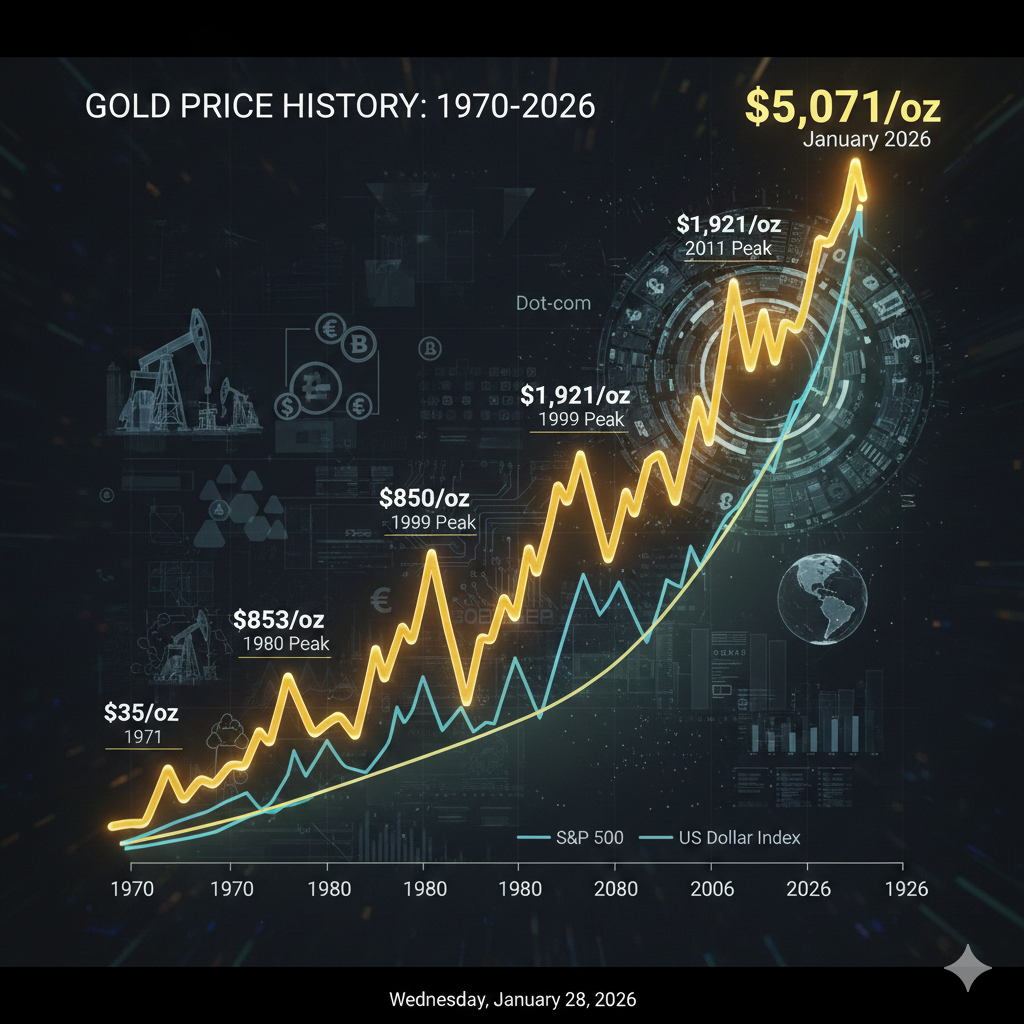
The history of gold over the last 50 years is a narrative of transition from a fixed monetary anchor to a highly reactive global barometer of geopolitical and economic health. Since the formal end of the gold standard in the early 1970s, the metal has experienced massive bull runs, decade-long stagnations, and recent record-shattering climbs.
1. The 1970s: The Great Unshackling
The modern era of gold pricing began in 1971 when President Nixon ended the U.S. dollar’s direct convertibility to gold. This “Nixon Shock” essentially let the price float freely for the first time in modern history.
- 1971–1979: Inflation and the energy crisis drove a massive flight to safety. Gold rose from roughly $35/oz in 1970 to over $500/oz by late 1979. [^1]
- The 1980 Peak: Driven by the Soviet invasion of Afghanistan and double-digit inflation, gold hit a then-record of $850/oz in January 1980. Adjusted for inflation, this remained the “true” peak for nearly 45 years. [^2]
2. 1980–2000: The “Lost Decades”
Following the 1980 peak, gold entered a long period of decline and consolidation. This was largely due to the aggressive interest rate hikes by Fed Chair Paul Volcker, which crushed inflation and made the U.S. dollar attractive again.
- The Bottom: By 1999, gold had slumped to a low of approximately $253/oz, as central banks began liquidating reserves and the “Dot-com” boom made equities the preferred asset class. [^3]
3. 2000–2012: The Financial Crisis Era
The new millennium brought a structural shift. Low interest rates, the 9/11 attacks, and the subsequent “War on Terror” reignited interest in gold.
- The 2008 Crash: While gold initially dipped during the immediate liquidity crunch of the Great Recession, it quickly rebounded as central banks launched Quantitative Easing (QE). [^4]
- 2011 Peak: Ongoing concerns over the Eurozone debt crisis pushed gold to a new nominal high of $1,921/oz in September 2011. [^5]
4. 2020–2026: The New Golden Age
The current decade has seen gold reach unprecedented heights, fueled by a “perfect storm” of a global pandemic, high inflation, and significant central bank buying from emerging markets like China and India.
- COVID-19 & Beyond: Gold broke $2,000/oz for the first time in August 2020. [^2]
- The 2024–2026 Surge: In late 2024, gold began a vertical ascent, breaking through $2,700. By January 2026, prices surged past the $5,000/oz mark, reflecting a major revaluation of the metal against a backdrop of global currency instability and trade tensions. [^6] [^7]
Summary of Major Milestones (Nominal Prices)
| Era | Approx. Low | Approx. High | Primary Driver |
| 1970s | $35 | $850 | Stagflation & Oil Crisis |
| 1980s-90s | $253 | $500 | High Interest Rates & Tech Boom |
| 2000-2012 | $270 | $1,921 | Global Financial Crisis |
| 2020-2026 | $1,450 | $5,071+ | Inflation & Geopolitics |
Footnotes
[^1]: Investopedia: Understanding the Dynamics Behind Gold Prices
[^2]: JM Bullion: History of Gold Prices – 100 Years of Data
[^3]: World Gold Council: Gold Spot Prices & Market History
[^4]: Macrotrends: Gold Prices – 100 Year Historical Chart
[^5]: Best Brokers: Gold Price Performance Historical Analysis
[^6]: Discovery Alert: Gold Price Surge Breaks $5,000 (Jan 2026)