While gold is often viewed as a steady store of wealth, silver is its high-velocity sibling. Over the last 30 years, silver has functioned as a hybrid asset—part precious metal, part essential industrial commodity—leading to price swings far more dramatic than those seen in the gold market.
1. 1996–2003: The Era of “Cheap Silver”
In the late 1990s, silver was overlooked. Technology stocks were the focus of the global market, and inflation remained low.
- The $5 Floor: For much of this period, silver languished between $4 and $6/oz. [^1]
- The Buffett Factor (1998): In a rare moment of volatility for the era, Warren Buffett’s Berkshire Hathaway purchased nearly 130 million ounces, briefly spiking the price to $7.81/oz before it settled back into its low range. [^2]
2. 2004–2011: The Great Bull Run
The mid-2000s marked a structural shift as industrial demand for electronics grew and the U.S. dollar began a long-term decline.
- The Pre-Crisis Climb: By 2006, silver broke the double-digit barrier for the first time in decades, reaching $15/oz. [^3]
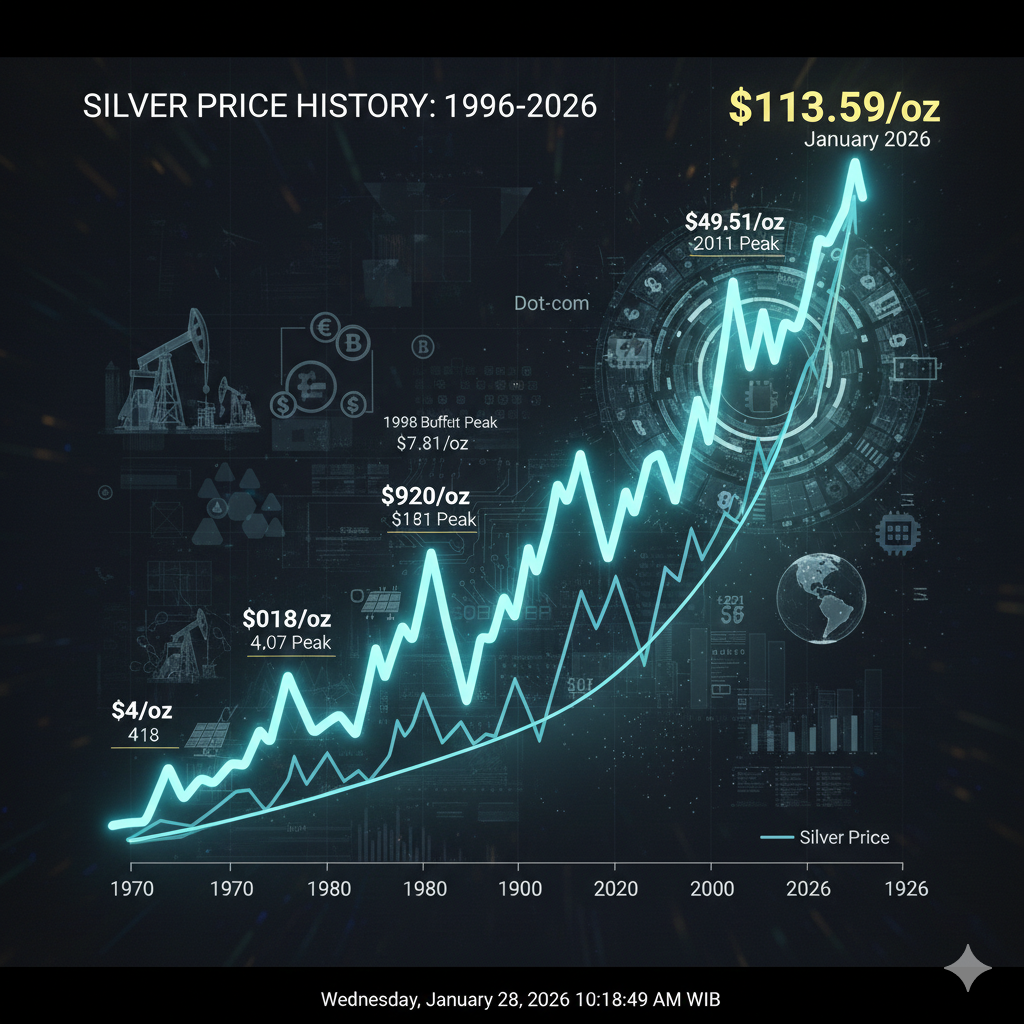
- The 2011 Peak: Following the 2008 financial crisis, massive “Quantitative Easing” (money printing) by central banks sparked fears of currency debasement. Silver went on a vertical tear, hitting an all-time nominal high of $49.51/oz in April 2011. [^1] [^4]
3. 2012–2019: The Long Correction
After the 2011 peak, silver entered a painful “bear market” as the global economy stabilized and the U.S. dollar strengthened.
- The $15 Anchor: Prices spent years retracing, eventually finding a stable floor around the $14–$18/oz range. [^3]
- Industrial Shift: During this time, silver’s role began shifting from photography (which had collapsed) to green energy, specifically photovoltaic cells for solar panels. [^5]
4. 2020–2026: The Tech and Inflation Explosion
The current decade has redefined silver’s value. The combination of the COVID-19 pandemic, a “silver squeeze” retail movement, and the global green energy transition created a supply deficit.
- The 2021 Squeeze: Influenced by social media movements, retail investors attempted to trigger a “short squeeze” on silver, briefly pushing prices toward $30/oz. [^2]
- 2025–2026 Surge: In late 2025, a massive revaluation occurred. Driven by its “high beta” nature (moving faster than gold) and its indispensability to the solar and EV industries, silver skyrocketed. By January 2026, prices reached a staggering $108.83/oz. [^1] [^6]
Silver Price Milestones (1996–2026)
| Year | Key Price Level | Primary Market Event |
| 1998 | $7.81 | Warren Buffett’s massive silver accumulation. |
| 2003 | $4.07 | The 30-year “low” before the commodities boom. |
| 2011 | $49.51 | Post-GFC safe-haven peak. |
| 2020 | $12.12 | March “Flash Crash” during COVID lockdowns. |
| 2026 | $113.59+ | New all-time record highs reached in late January. |
Footnotes
[^1]: BullionByPost: Silver Price per Ounce – Last 30 Years Chart
[^2]: JM Bullion: 30-Year Silver Price History and Analysis
[^3]: Vaulted: 100 Years of Silver Price History (1925-Present)
[^4]: Wikipedia: Silver as an Investment – The 2011 Peak
[^5]: Silver Institute: Factors Determining the Silver Price (Industrial vs. Monetary)
[^6]: CME Group: The Relative Value Prospects of Precious Metals in 2026